AI gateway latency guide: measure the hop, the provider and the rescued request
A gateway adds a real hop, but the user experiences the whole request path. Measure client round trip, time to first token, stream duration and gateway processing separately. Keep first attempts, retries, fallbacks and cache hits in different cohorts so an average does not hide why a request was fast or slow.
Published 2026-08-15 · Updated 2026-09-29 · KeepRouter Editorial · 5 minute read
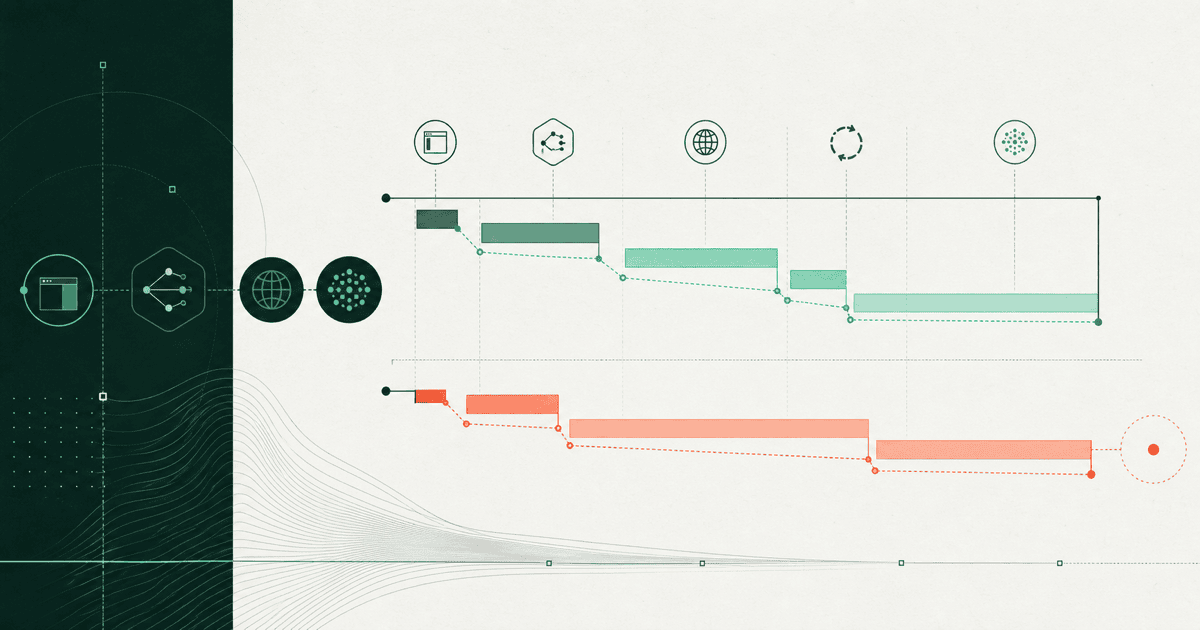
Short answer: compare an AI gateway and a direct provider path with the same client region, model route, prompt, output cap, streaming mode and connection state. Report time to first token and total completion at p50, p95 and p99. Tag retries, fallbacks and cache outcomes instead of blending them into one average.
The gateway's own processing time matters, but it is only one part of user-visible latency. DNS, TLS, connection reuse, request upload, gateway admission, provider routing, provider queue, model generation, stream delivery and client parsing all contribute.
Define the clocks before collecting data
| Clock | Start | Stop | Product question answered |
|---|---|---|---|
| Client round trip | Immediately before send | Terminal response or error | How long did the user wait? |
| Time to first byte | Before send | First response byte | How quickly did the path begin responding? |
| Time to first token | Before send | First usable model output | How responsive did generation feel? |
| Stream duration | First token | Terminal event | How long did output generation and delivery take? |
| Gateway pre-upstream | Gateway receive | Upstream request send | What admission, transformation and routing work occurred? |
| Gateway post-upstream | Upstream response receive | Client response send | What normalization, logging or billing work occurred? |
Do not compare a vendor's internal processing number with another vendor's client round trip. Do not compare an average from one region with a tail percentile from another. Write the measurement definition beside every result.
Build a reproducible request corpus
Use production-shaped payloads after removing secrets. Include a short non-streaming call, a streamed response, a representative long context, a tool call and an expected failure. Fix the public model ID and, where the product lets you control it, the provider route and model revision.
Set the same output cap. Otherwise one model or route can appear slower because it produced more useful text. Keep temperature and reasoning controls stable where they take effect. Store response usage and terminal status with timing data.
Control the network path
Run direct and gateway requests from the same compute location. Record whether DNS and TLS were warm, whether HTTP connections were reused, and whether the gateway or provider had a cold start. A browser on residential internet and a server in a cloud region answer different questions.
Test at low concurrency first, then at the concurrency your application expects. Queueing can be invisible in a single request and dominant during a burst. Use enough samples for tail percentiles to mean something, and publish the sample count.
Split results by route outcome
| Cohort | Keep separate because |
|---|---|
| First-attempt success | Shows the normal route without recovery cost |
| Same-route retry | Includes an avoidable or necessary second attempt |
| Provider failover | Changes network, queue, cache and possibly data policy |
| Model fallback | Changes generation behavior and output length |
| Cache hit | May skip model generation entirely |
| Cache miss | Pays lookup plus normal generation |
A fallback can improve completion rate while making that request slower. That may be a good product trade, but a single latency average cannot explain it. Pair timing with success and task-quality outcomes. The failover design guide shows how to identify the attempts.
Inspect gateway work without guessing
Authentication, quota checks, policy lookup, request transformation, log writes, cost calculation, cache access and response normalization can add time. The critical path depends on implementation. A remote database or synchronous log sink can matter more than the proxy code itself.
Use trace spans or gateway timestamps where available. Confirm that clocks are synchronized before subtracting timestamps from different systems. If the product exposes only client-visible data, report that boundary instead of inventing internal attribution.
Measure streaming as a stateful protocol
Record the first valid event, first content token, tool-call event, usage event and terminal event. A connection can open quickly and still delay usable content. A stream that never sends a terminal event can look fast in a first-byte chart while leaving accounting and client state incomplete.
Cancel a stream and observe when provider work and billing stop. Test backpressure with a slow client. The gateway should not buffer an unbounded stream or reorder events the client depends on.
Read a timeline before attributing the delay
In an illustrative trace, a request starts at 0 ms, headers arrive at 100 ms, useful text appears at 900 ms and the answer ends at 4,000 ms. Reporting “100 ms latency” would hide most of the wait. The user experienced 900 ms to useful text and 4 seconds to completion. OpenTelemetry's trace model can organize the application spans. Without correlated measurements on the same model and path, the gap between these clocks cannot be assigned to gateway overhead.
Set budgets that match the interaction
Autocomplete, chat, coding agents and background jobs need different budgets. Define an acceptable p95 increase for time to first token and total completion, plus a maximum total deadline for retries. Monitor the same metrics after release because provider selection and upstream load change.
Use does an AI gateway add latency for the concise explanation and the AI gateway evaluation framework to combine latency with contract, reliability, security and cost evidence.
Frequently asked questions
What latency percentile should I report?
Report at least p50 and p95, and p99 when the sample size supports it. Include sample count and test window.
Should cache hits be included in the average?
Report them as a separate cohort. A cache hit and a generated response are different execution paths.
Can time to first byte replace time to first token?
No. A gateway can send headers or metadata before usable model output, so both clocks answer different questions.
How should retries appear in latency reports?
Tag every attempt and report first-attempt success separately from rescued requests and exhausted failures.
Sources reviewed
Article last reviewed 2026-09-29
- [1] OpenTelemetry trace concepts
- [2] Cloudflare AI Gateway analytics
- [3] Vercel AI Gateway observability
- [4] KeepRouter API observability